

TD Nigeria’s rising public debt and continued naira depreciation remain central issues in national economic discourse.
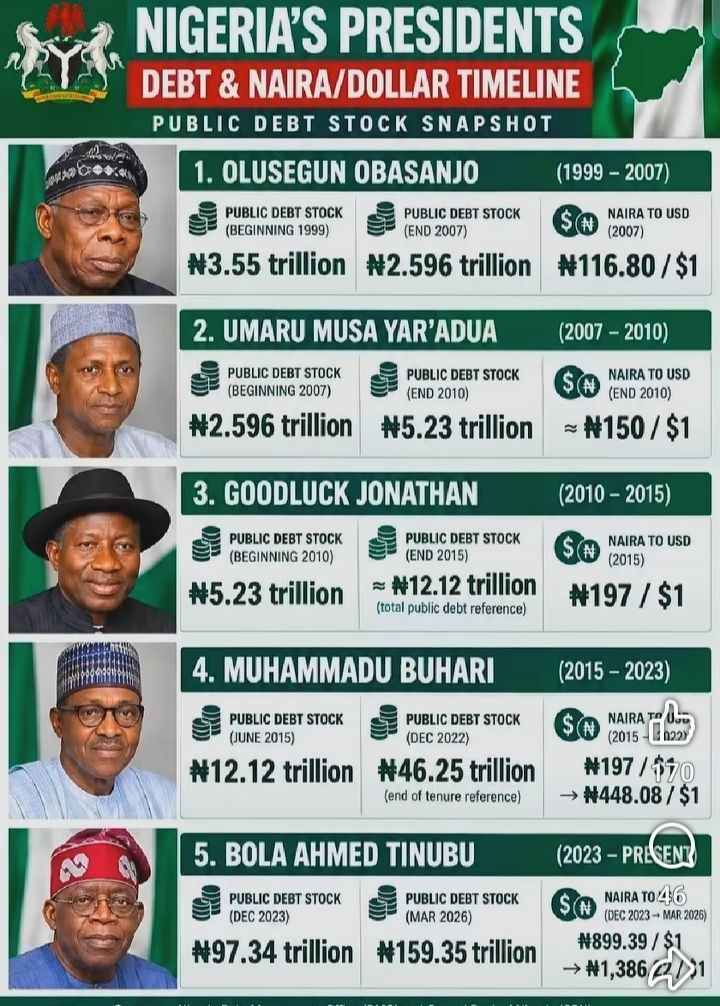
An infographic circulating on social media compares Nigeria’s debt profile and exchange-rate performance under successive administrations since 1999.
It highlights major changes in public borrowing and the value of the national currency over the past 27 years.
The graphic covers the administrations of former Presidents Olusegun Obasanjo, Umaru Musa Yar’Adua, Goodluck Jonathan, and Muhammadu Buhari.
It also covers the current administration of President Bola Ahmed Tinubu.
The infographic presents public debt figures at the beginning and end of each administration.

It also provides corresponding naira-to-dollar exchange rates for the respective periods.
Obasanjo Administration: Debt Reduction
According to the infographic, Nigeria’s public debt stood at approximately ₦3.55 trillion when Obasanjo assumed office in 1999.
By the end of his tenure in 2007, the figure had declined to ₦2.596 trillion.
During the same period, the naira traded at approximately ₦116.80 to one United States dollar.
Economic analysts have frequently cited Nigeria’s debt relief agreement during the Obasanjo administration as a major reason for the reduction.
In 2005, Nigeria reached a landmark debt forgiveness agreement with the Paris Club, cancelling a substantial portion of the country’s external debt.

The agreement significantly reduced Nigeria’s external debt obligations and provided greater fiscal space for the government.
Yar’Adua Administration: Rising Borrowing
Following Obasanjo’s departure, President Umaru Musa Yar’Adua inherited public debt of approximately ₦2.596 trillion in 2007.
By the end of his administration in 2010, public debt had increased to approximately ₦5.23 trillion.
The infographic indicates that the naira traded at about ₦150 to the dollar at the end of Yar’Adua’s tenure.
His administration coincided with significant global economic uncertainties, including the aftermath of the 2008 global financial crisis.
Nigeria maintained relative economic stability during the period, although government borrowing increased to finance infrastructure and development projects.

Jonathan Administration: Debt Expansion
Goodluck Jonathan’s administration followed Yar’Adua’s government in 2010.
The period witnessed another substantial increase in Nigeria’s public debt.
The infographic states that debt increased from ₦5.23 trillion in 2010 to approximately ₦12.12 trillion by 2015.
During the same period, the naira weakened to approximately ₦197 per dollar.
The Jonathan years were characterised by relatively strong oil revenues for much of the administration.
However, declining crude oil prices toward the end of the period placed significant pressure on government finances and foreign exchange reserves.
Economic experts have linked those pressures to increasing fiscal deficits and mounting debt obligations.
Buhari Administration: Significant Debt Growth
Muhammadu Buhari inherited a public debt stock of ₦12.12 trillion when he assumed office in 2015.
According to the infographic, public debt expanded significantly during his eight-year administration.
It reached approximately ₦46.25 trillion by December 2022.
The naira also experienced substantial depreciation during the Buhari years.
It moved from about ₦197 per dollar in 2015 to approximately ₦448.08 by December 2022.
Buhari’s government defended increased borrowing as necessary to finance major infrastructure projects across the country.
These projects included roads, railways, bridges, and power initiatives.
Government officials maintained that Nigeria’s debt remained manageable when measured against Gross Domestic Product (GDP).
Critics, however, raised concerns about the pace of borrowing and its impact on government finances.
Several economic reports showed that debt-service obligations were consuming an increasing share of federal revenues.
This reduced the fiscal space available for other developmental expenditures.
Tinubu Administration: Debt and Currency Pressure
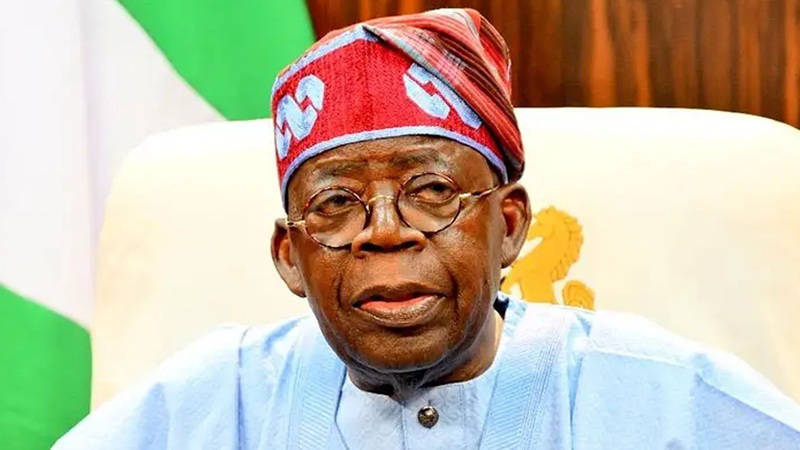
Under President Bola Ahmed Tinubu, the infographic places Nigeria’s public debt at approximately ₦97.34 trillion in December 2023.
By March 2026, the figure had reportedly risen to approximately ₦159.35 trillion.
The naira also weakened further during the period.
It moved from around ₦899 per dollar in late 2023 to approximately ₦1,386 by March 2026.
The Tinubu administration has introduced several economic reforms aimed at restructuring Nigeria’s economy.
Among the most notable measures are fuel subsidy removal and the liberalisation of the foreign exchange market.
Government officials say the reforms are intended to attract investment, improve fiscal sustainability, and create a more market-driven economy.
How Debt Figures Should Be Interpreted
Economists caution that public debt figures should not be considered in isolation from broader economic conditions.
Debt can rise in nominal terms because of inflation, exchange-rate adjustments, and changes in debt-reporting methodologies.
The figures can also change when liabilities from different government entities are included in official calculations.
Experts stress that debt sustainability depends on more than the amount borrowed.
It also depends on how borrowed funds are used, the country’s revenue-generating capacity, and the pace of economic growth.
Borrowing for productive investments can support economic expansion and potentially improve future government revenues.
Debt accumulated without corresponding improvements in productivity and revenue can create greater long-term fiscal pressure.
The Wider Economic Debate
The figures presented in the infographic have renewed public discussions about Nigeria’s fiscal management and economic direction.
They have also intensified debates over debt sustainability, currency stability, and government borrowing.
With public debt reaching unprecedented levels, policymakers face increasing pressure to demonstrate how borrowed funds are being utilised.
The continuing depreciation of the naira has added another layer of complexity to Nigeria’s economic challenges.
Policymakers must therefore balance economic reforms with measures that protect citizens from rising living costs.
Nigeria’s 27-Year Economic Journey
The comparative record of successive administrations highlights the complexity of Nigeria’s economic journey since the return to democratic rule in 1999.
Each administration has adopted different strategies to address infrastructure, economic growth, revenue generation, and fiscal challenges.
However, debt management and currency stability have remained persistent concerns throughout the period.
The figures also demonstrate how Nigeria’s fiscal position and exchange rate have changed considerably across successive administrations.
As the debate continues, the central question remains whether rising borrowing can translate into stronger economic growth and improved living standards.